

Tools

The GeEAUde partnership chair aims to develop digital tools that enable :

To simulate the current and future hydrodynamic functioning of aquifers based on anthropogenic and climatic forcings,

Integrate modeling and monitoring tools into a dynamic forecasting platform that provides managers with real-time, informed decision support.

The development of such tools began as soon as the GeEAUde partnership chair was launched, with the aim of facilitating access to and use of hydrogeological and, more broadly, environmental data.
Data GeEAUde

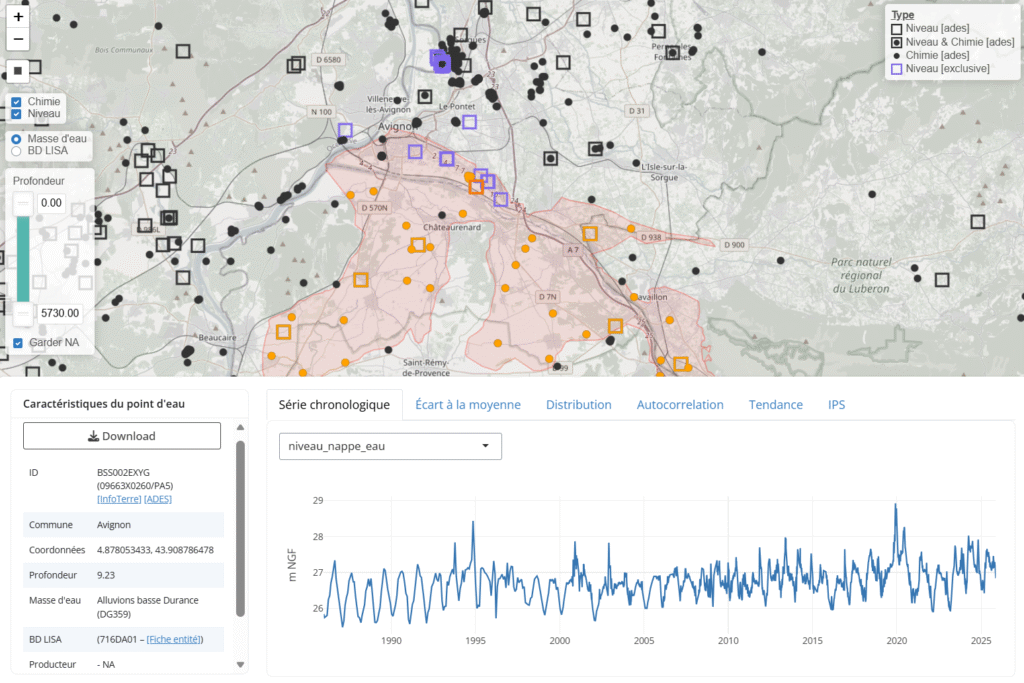
Interactive web application for aggregating and analyzing environmental data

  • Access to ADES data (Metropolitan France)
  • Automatic analysis of time series
  • Daily data updates
  • Download data, metadata, and related documents
  • Several legends available for display (trends, IPS)

Accessibility : for GeEAUde members only

Technical stack :  R, R shiny, CSS, javascript, host : Web Docker

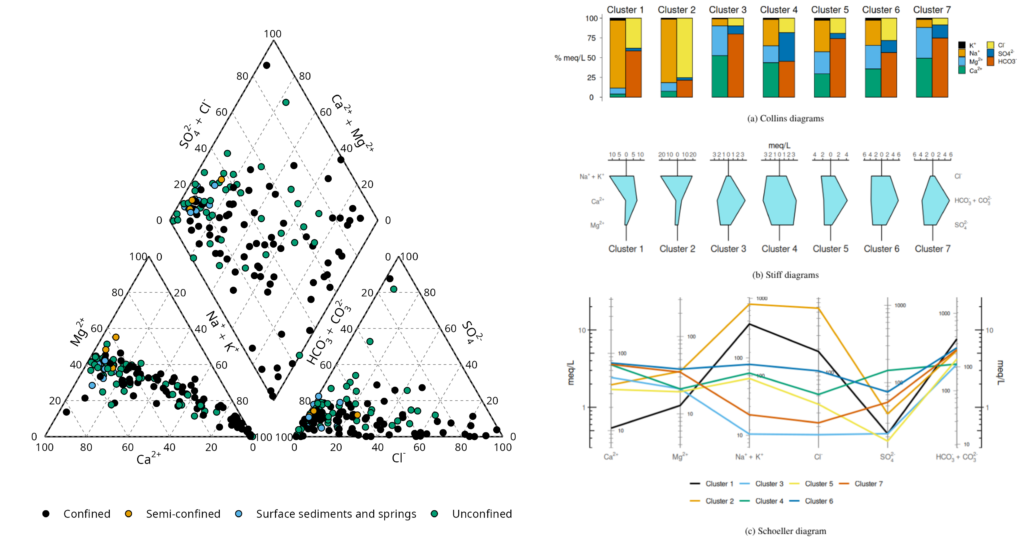
hydrochem plots

Accessibility : open access

Technical stack :  R

Developped in collaboration with the SNO KARST

hydrochem

R Library for Hydrochemical Data Processing, Analysis, and Visualization

  • Free and open-source under GPL-2 license — enables a complete hydrochemical processing workflow within R
  • Accessible to non-programmers while remaining flexible for advanced users
  • Available as a stable release on CRAN: install.packages("hydrochem")
  • More information in the associated article:
    https://lien-a-venir
  • Source code available on GitHub:
    https://github.com/snokarst-tools/hydrochem

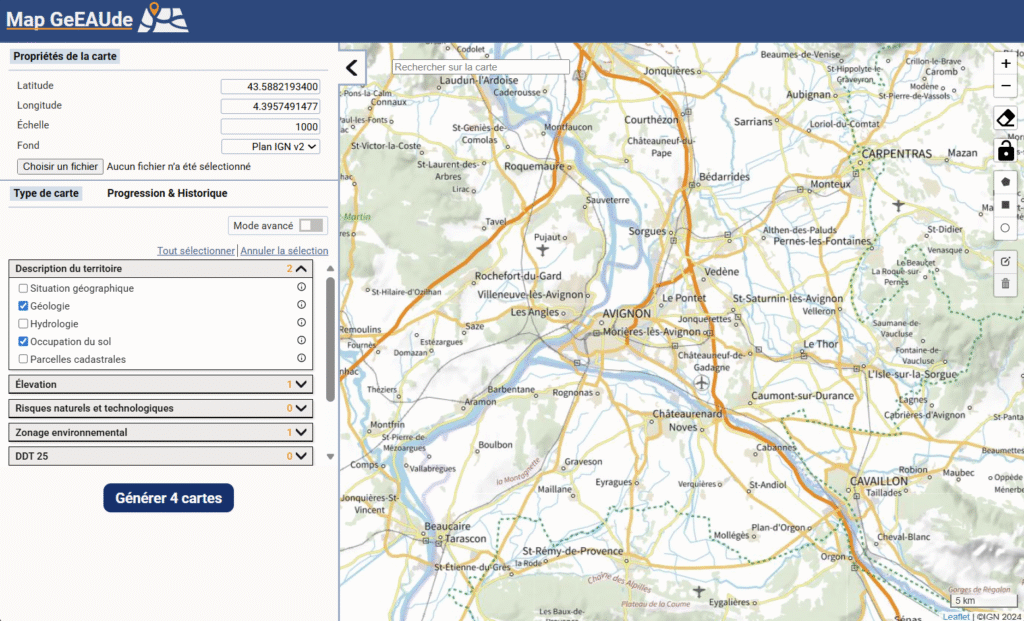
Map GeEAUde

GIS web application facilitating map generation

  • Simplified map generation with cartouche (including legend and attributions, scale: France)
  • Extensive geographic data available and regularly updated
  • Several base maps available
  • Customizable generation of map groups

Accessibility : for GeEAUde members only

Technical stack :  Python, HTML, CSS, javascript, host : Web Docker

Accessibility : open access

Technical stack :  R, R shiny, CSS, javascript, host : Web Docker

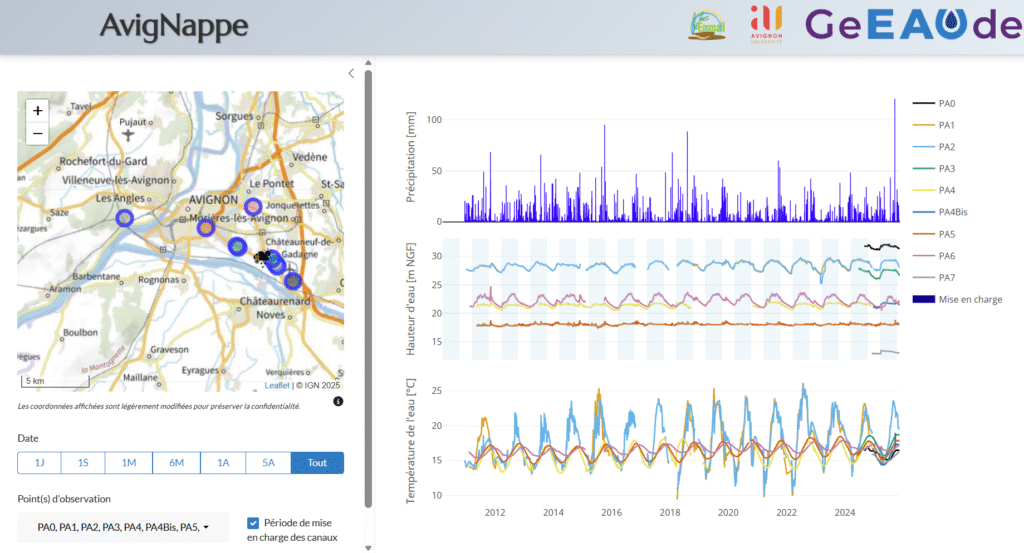
AvigNappe

Web application for processing and visualizing piezometric data

  • Piezometric monitoring of the Avignon plain aquifer (Avignon University Hydrogeology Laboratory)
  • Interactive visualization of data
  • Automatic transmission, processing, and storage of raw data